Apologies if this is a basic question but when constructing a confidence interval do you only ever use the critical/lookup T values? I also have the Schweser notes which suggests sometimes you'd use the Z-statistic as opposed to the T statistic:
Apologies if this is a basic question but when constructing a confidence interval do you only ever use the critical/lookup T values? I also have the Schweser notes which suggests sometimes you'd use the Z-statistic as opposed to the T statistic:
The search function in the forum is very helpful with questions like this. I did a quick search, and I found a couple of threads that may be helpful in answering your question:
Hi @tbc1984 Just to briefly add to Nicole's links, that copied table of course refers to a sample mean. You will notice that the t-stat is used whenever the variance is unknown. That's the realistic use case: we typically observe samples, we don't typically know the population's variance. The realistic fact that we typically (outside of a textbook) substituting the observed sample variance, S^2, for the unknown population variance, σ^2, is the reason the t-stat is used (we lose a degree of freedom). In this way, the student's t is approximating the normal distribution, and the normal distribution is theoretically really justifying everything in the chart:
When sampling from a normal (top two rows), we probably intuitively would expect the sample mean to also be normal
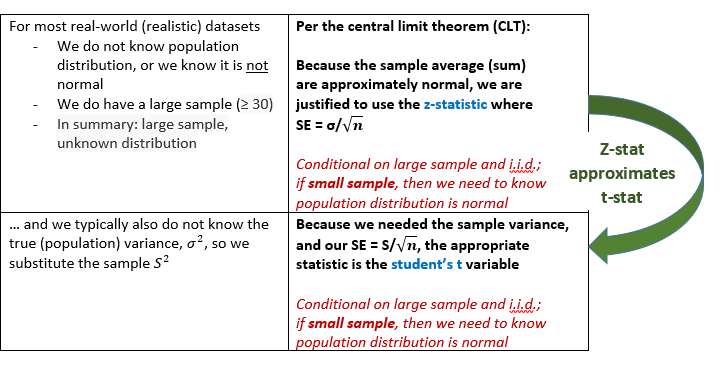
But central limit theorem (CLT) provides the more interesting (astonishing) insight of the bottom two rows: if the observations are i.i.d. (the key assumption), even if the distribution is non-normal, as the sample gets larger, the sample mean distribution is approximately normal. So notice there is really only one pair of conditions for large samples (is the only reason I could get a little confused by the table): the (i.i.d) sample mean for large samples, regardless of population, is approximately normal for all distributions. And the z-statistic is justified. But if we lose the degree of freedom (ie, don't know true variance), we should use the student's t. At the same time, per the footnote it's okay to use the normal for large samples (because at high df, the normal is approximating the student's anyhow ... yes i do mean to say that the normal is approximating the student's t, if we don't know the true variance). It's still true that, if you don't have the population variance, the student's t is the correct choice. I hope that helps, thanks!
Also @tbc1984 for what it's worth, I don't disagree with the table. Rather, I think why I don't love it is how the repetitive framework obscures what i think is the important part (i.e., the implication of CLT). Here's how I would re-cast it, see below. I hope it's interesting, thanks!
Thank you David, your explanation is very helpful as usual.
Wanted to say that I really appreciate the content here in the free section of the forum. Don't feel like I'm freeloading either, because I bought BT notes back in 2015 but then didn't have any time to study because of work
This site uses cookies to help personalise content, tailor your experience and to keep you logged in if you register.
By continuing to use this site, you are consenting to our use of cookies.
")