enjofaes
Active Member
Hi all did a small exercise using python testing for significance between exam periods: may vs november:
For Exam Part I: t-statistic = -2.011196301935959, p-value = 0.06043684233771963
For Exam Part II: t-statistic = -1.634588808440973, p-value = 0.12051553830588412
Made with our dear friend. You can always take a look https://chat.openai.com/share/f073faf8-d9e7-42f0-856a-369361cf9501
Python:
# -*- coding: utf-8 -*-
"""
Created on Wed May 31 07:57:29 2023

@author: efaes
"""

import pandas as pd

data = {
    "Administration": ['May 2013', 'November 2013', 'May 2014', 'November 2014', 'May 2015', 'November 2015',
                       'May 2016', 'November 2016', 'May 2017', 'November 2017', 'May 2018', 'November 2018',
                       'May 2019', 'November 2019', 'October 2020', 'November 2020', 'May 2021', 'November 2021',
                       'May/Aug 2022', 'November 2022'],
    "Exam Part I": [ 0.46, 0.51, 0.42, 0.49, 0.43, 0.49, 0.45, 0.45, 0.42,
                    0.42, 0.41, 0.5, 0.42, 0.46, 0.44, 0.45, 0.47, 0.45, 0.51, 0.5],
    "Exam Part II": [ 0.57, 0.58, 0.58, 0.59, 0.52, 0.62, 0.5, 0.54, 0.54,
                     0.52, 0.53, 0.56, 0.6, 0.59, 0.62, 0.59, 0.59, 0.63, 0.57, 0.59]
}

frm_pass_rates = pd.DataFrame(data)

may_data = frm_pass_rates[frm_pass_rates['Administration'].str.contains('May')]
nov_data = frm_pass_rates[frm_pass_rates['Administration'].str.contains('November')]

import matplotlib.pyplot as plt
import seaborn as sns

# Convert 'Administration' to datetime format
frm_pass_rates['AdminDate'] = pd.to_datetime(frm_pass_rates['Administration'], errors='coerce')

# Some dates are missing due to the 'May/Aug 2022' value, let's handle that separately
frm_pass_rates.loc[frm_pass_rates['Administration'] == 'May/Aug 2022', 'AdminDate'] = pd.to_datetime('May 2022')

# Now, sort the DataFrame by 'AdminDate'
frm_pass_rates = frm_pass_rates.sort_values(by='AdminDate')

# Separate data for May and November administrations
may_data = frm_pass_rates[frm_pass_rates['Administration'].str.contains('May')]
nov_data = frm_pass_rates[frm_pass_rates['Administration'].str.contains('November')]

# Plot the data again
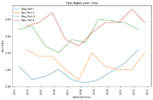
plt.figure(figsize=(10,6))
sns.lineplot(data=may_data, x='AdminDate', y='Exam Part I', label='May Part I')
sns.lineplot(data=nov_data, x='AdminDate', y='Exam Part I', label='Nov Part I')
sns.lineplot(data=may_data, x='AdminDate', y='Exam Part II', label='May Part II')
sns.lineplot(data=nov_data, x='AdminDate', y='Exam Part II', label='Nov Part II')
plt.xlabel('Administration')
plt.ylabel('Pass Rate')
plt.title('Pass Rates over Time')
plt.xticks(rotation=90)
plt.legend()
plt.show()


from scipy.stats import ttest_ind

# Exam Part I
t_stat_part1, p_val_part1 = ttest_ind(may_data['Exam Part I'], nov_data['Exam Part I'])
print(f"For Exam Part I: t-statistic = {t_stat_part1}, p-value = {p_val_part1}")

# Exam Part II
t_stat_part2, p_val_part2 = ttest_ind(may_data['Exam Part II'], nov_data['Exam Part II'])
print(f"For Exam Part II: t-statistic = {t_stat_part2}, p-value = {p_val_part2}")
For Exam Part I: t-statistic = -2.011196301935959, p-value = 0.06043684233771963
For Exam Part II: t-statistic = -1.634588808440973, p-value = 0.12051553830588412
- The pass rates for both Exam Part I and Exam Part II seem to be slightly higher in November than in May. This conclusion is drawn from the negative t-statistics, indicating that the mean pass rate in May is less than that in November.
- For Exam Part I, the difference in pass rates between May and November is not statistically significant at the conventional 5% level, but it is somewhat close. This means that we can't confidently say the observed difference is due to anything other than random chance, but the p-value of 0.060 suggests some potential evidence of a difference.
- For Exam Part II, the difference in pass rates between May and November is also not statistically significant at the conventional 5% level, and the evidence is less strong than for Exam Part I, with a p-value of 0.121.
- Although these statistics suggest a slight tendency for higher pass rates in November, it's important to remember that many other factors can influence pass rates. These factors can include changes in exam difficulty from year to year, the particular group of candidates taking the exam, and other aspects not captured in this data.
- As an individual candidate, your chances of passing the exam are more likely to be influenced by your personal preparation and understanding of the material rather than the overall pass rates in May versus November.
- Finally, while these statistics provide some insight, they don't establish causation. We can't definitively say that taking the exam in November causes higher pass rates, only that there's an observed association in this particular set of data.
Made with our dear friend. You can always take a look https://chat.openai.com/share/f073faf8-d9e7-42f0-856a-369361cf9501


