Learning objectives: Describe sample autocorrelation and partial autocorrelation. Describe the Box-Pierce Q-statistic and the Ljung-Box Q statistic.
Questions:
20.24.1. The autocorrelation function (ACF) is typically paired with the partial autocorrelation function (PACF). About the ACF and PACF, EACH of the following statements is true EXCEPT which is false?
a. The PCF is equal to the ACF scaled (i.e., divided) by the square root of the sample size; i.e., PACF(i) = ACF(i)*1/sqrt(T)
b. An AR(p) sharply drops off (aka, cuts off) after (p) lags in the PACF while the MA(q) sharply drops off after (q) lags in the ACF
c. The ACF and PACF are identical at the first lag and (assuming the process is covariance stationary) both the ACF and PACF approach zero, even if oscillating, as displacement increases
d. Both ACF and PACF measure the correlation between a value, Y(t), and its lagged value, Y(t-i) but PACF removes (aka, controls for) the effect of the interim values between Y(t) and Y(t-i).
20.24.2. Elizabeth is an economist tasked with modeling quarterly gross domestic product (GDP) in the United States. She starts with the plots displayed below. The raw data is displayed in the upper; she observes this GDP trend is obviously not stationary (why?). She then performs a typical transformation on the raw data: she takes the difference of the natural log of the quarterly GPD values. This plot is displayed in the lower panel. Because LN[GDP(t)] - LN(GDP(t-1)] = LN[GDP(t)/GDP(t-1)], this lower panel plots continuously compounded returns (aka, monthly log returns). First differencing the log returns occasionally renders the non-stationary trend into a stationary process.

She then fits an autoregressive, AR(1), and moving average, MA(1), model to the log return series. This gives her three models: the log return series (called "diff_logs"), an AR(1) model, and an MA(1) model. She conducts a Box-Pierce test on each of these models; the test of the AR(1) and MA(1) is a test of the residuals. She selects two lags for the test, h = 10 and h = 20. The results of her Box-Pierce test are displayed below.

If we assume her desired confidence level is 95.0%, which of the following statements is a TRUE statement with respect to an interpretation of her Box-Pierce test of the three models?
a. None of the residuals are white noise; i.e., neither the transformed log returns nor AR(1) nor MA(1) is a candidate model
b. The AR(1) is a candidate because its residuals appear to be approximately white noise
c. The MA(1) is a candidate because its residuals appear to be approximately white noise
d. All of the residuals are white noise; i.e., all three models are candidates
20.24.3. Eric is a commodity analyst who fits four different candidate AR(p) models to a series of oil prices. For each of the candidate models, he then retrieved the Akaike information criterion (AIC) and the Bayesian information criterion (BIC). The results are displayed below.
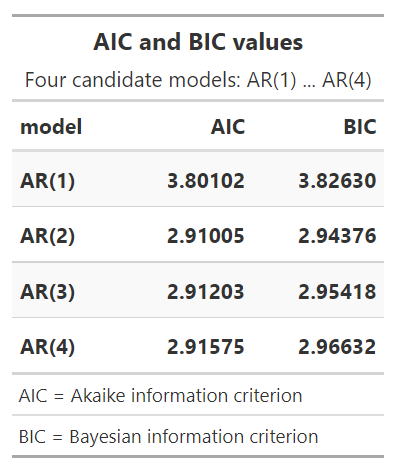
As Eric interprets the results of these criteria (i.e., the AIC and BIC values), which of the following statements is TRUE?
a. Both criteria (AIC and BIC) favor the AR(1) model
b. Both criteria (AIC and BIC) favor the AR(2) model
c. As both criteria are insignificant, any AR(p) model is a bad fit
d. The criteria disagree and therefore the AIC's preference should prevail because it prefers fewer lags
Answers here:
Questions:
20.24.1. The autocorrelation function (ACF) is typically paired with the partial autocorrelation function (PACF). About the ACF and PACF, EACH of the following statements is true EXCEPT which is false?
a. The PCF is equal to the ACF scaled (i.e., divided) by the square root of the sample size; i.e., PACF(i) = ACF(i)*1/sqrt(T)
b. An AR(p) sharply drops off (aka, cuts off) after (p) lags in the PACF while the MA(q) sharply drops off after (q) lags in the ACF
c. The ACF and PACF are identical at the first lag and (assuming the process is covariance stationary) both the ACF and PACF approach zero, even if oscillating, as displacement increases
d. Both ACF and PACF measure the correlation between a value, Y(t), and its lagged value, Y(t-i) but PACF removes (aka, controls for) the effect of the interim values between Y(t) and Y(t-i).
20.24.2. Elizabeth is an economist tasked with modeling quarterly gross domestic product (GDP) in the United States. She starts with the plots displayed below. The raw data is displayed in the upper; she observes this GDP trend is obviously not stationary (why?). She then performs a typical transformation on the raw data: she takes the difference of the natural log of the quarterly GPD values. This plot is displayed in the lower panel. Because LN[GDP(t)] - LN(GDP(t-1)] = LN[GDP(t)/GDP(t-1)], this lower panel plots continuously compounded returns (aka, monthly log returns). First differencing the log returns occasionally renders the non-stationary trend into a stationary process.
She then fits an autoregressive, AR(1), and moving average, MA(1), model to the log return series. This gives her three models: the log return series (called "diff_logs"), an AR(1) model, and an MA(1) model. She conducts a Box-Pierce test on each of these models; the test of the AR(1) and MA(1) is a test of the residuals. She selects two lags for the test, h = 10 and h = 20. The results of her Box-Pierce test are displayed below.
If we assume her desired confidence level is 95.0%, which of the following statements is a TRUE statement with respect to an interpretation of her Box-Pierce test of the three models?
a. None of the residuals are white noise; i.e., neither the transformed log returns nor AR(1) nor MA(1) is a candidate model
b. The AR(1) is a candidate because its residuals appear to be approximately white noise
c. The MA(1) is a candidate because its residuals appear to be approximately white noise
d. All of the residuals are white noise; i.e., all three models are candidates
20.24.3. Eric is a commodity analyst who fits four different candidate AR(p) models to a series of oil prices. For each of the candidate models, he then retrieved the Akaike information criterion (AIC) and the Bayesian information criterion (BIC). The results are displayed below.
As Eric interprets the results of these criteria (i.e., the AIC and BIC values), which of the following statements is TRUE?
a. Both criteria (AIC and BIC) favor the AR(1) model
b. Both criteria (AIC and BIC) favor the AR(2) model
c. As both criteria are insignificant, any AR(p) model is a bad fit
d. The criteria disagree and therefore the AIC's preference should prevail because it prefers fewer lags
Answers here:
Last edited: