Concept: These on-line quiz questions are not specifically linked to AIMs, but are instead based on recent sample questions. The difficulty level is a notch, or two notches, easier than bionicturtle.com's typical AIM-by-AIM question such that the intended difficulty level is nearer to an actual exam question. As these represent "easier than our usual" practice questions, they are well-suited to online simulation.
Questions:
408.1. You regressed your firm's portfolio excess returns against the excess returns of two factors over the last 100 trading days, such that your multivariate regression contains two independent variables, Factor 1 and Factor 2. The regression results are displayed below.
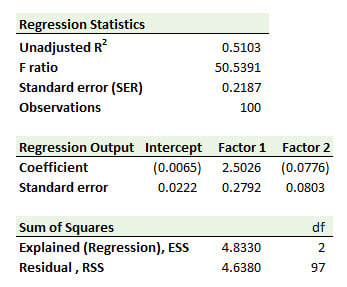
Your null hypothesis is a joint hypothesis that both Factors (i.e., both partial slope coefficients to Factor 1 and Factor 2 as independent variables) are equal to zero. Can you reject this joint null with 95.0% confidence?
a. No, because the adjusted R^2 is too low
b. No, because the t-stat of Factor 2 is too low
c. Yes, because the F ratio is high
d. Yes, because unadjusted R^2 is sufficiently low
408.2. You regressed your firm's portfolio excess returns against the excess returns of two factors over the last 80 trading days, such that your multivariate regression contains two independent variables, Factor 1 and Factor 2. The regression results are displayed below.
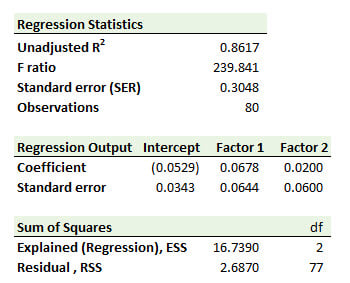
If this regression has a flaw (i.e., a potential violation of an assumption in the classical linear regression model), which of the following is the mostly likely interpretation of these regression results?
a. The high F ratio combined with the high R^2 suggests autocorrelation
b. The high F ratio combined with the low SER suggests heteroskedasticity
c. The high R^2 combined with the low SER suggests non-linear parameters
d. The high R^2 combined with insignificant individual coefficients suggests multicollinearity
408.3. While working from home, you regressed your firm's portfolio excess returns against the excess returns of two factors over the last 60 trading days, such that your multivariate regression contains two independent variables, Factor 1 and Factor 2. The regression results are displayed below, but there is a problem! Your nephew, who is visiting, drew a blue crayon over three cells on your report. On the printout, you can't see the unadjusted coefficient of determination (R^2), the F ratio, or the standard error of regression (SER):
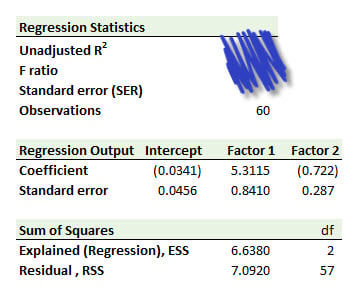
Which are nearest, respectively, to the R^2, F ratio, and SER (as a bonus, compute the adjusted R^2)?
a. R^2 = 0.4835, F ratio = 26.68, and SER = 0.3527
b. R^2 = 0.5165, F ratio = 38.20, and SER = 0.1244
c. R^2 = 0.6473, F ratio = 57.04, and SER = 1.333
d. R^2 = 0.6953, F ratio = 135.00, and SER = 6.510
Answers here:
Questions:
408.1. You regressed your firm's portfolio excess returns against the excess returns of two factors over the last 100 trading days, such that your multivariate regression contains two independent variables, Factor 1 and Factor 2. The regression results are displayed below.
Your null hypothesis is a joint hypothesis that both Factors (i.e., both partial slope coefficients to Factor 1 and Factor 2 as independent variables) are equal to zero. Can you reject this joint null with 95.0% confidence?
a. No, because the adjusted R^2 is too low
b. No, because the t-stat of Factor 2 is too low
c. Yes, because the F ratio is high
d. Yes, because unadjusted R^2 is sufficiently low
408.2. You regressed your firm's portfolio excess returns against the excess returns of two factors over the last 80 trading days, such that your multivariate regression contains two independent variables, Factor 1 and Factor 2. The regression results are displayed below.
If this regression has a flaw (i.e., a potential violation of an assumption in the classical linear regression model), which of the following is the mostly likely interpretation of these regression results?
a. The high F ratio combined with the high R^2 suggests autocorrelation
b. The high F ratio combined with the low SER suggests heteroskedasticity
c. The high R^2 combined with the low SER suggests non-linear parameters
d. The high R^2 combined with insignificant individual coefficients suggests multicollinearity
408.3. While working from home, you regressed your firm's portfolio excess returns against the excess returns of two factors over the last 60 trading days, such that your multivariate regression contains two independent variables, Factor 1 and Factor 2. The regression results are displayed below, but there is a problem! Your nephew, who is visiting, drew a blue crayon over three cells on your report. On the printout, you can't see the unadjusted coefficient of determination (R^2), the F ratio, or the standard error of regression (SER):
Which are nearest, respectively, to the R^2, F ratio, and SER (as a bonus, compute the adjusted R^2)?
a. R^2 = 0.4835, F ratio = 26.68, and SER = 0.3527
b. R^2 = 0.5165, F ratio = 38.20, and SER = 0.1244
c. R^2 = 0.6473, F ratio = 57.04, and SER = 1.333
d. R^2 = 0.6953, F ratio = 135.00, and SER = 6.510
Answers here:
Last edited by a moderator: