P1.T2.699. Linear and nonlinear trends (Diebold)

Nicole Seaman

Director of CFA & FRM Operations
Staff member
Subscriber
Learning objectives: Describe linear and nonlinear trends. Describe trend models to estimate and forecast trends

Questions:

699.1. Consider the following quadratic trend model:

P1.T2.699.1.png

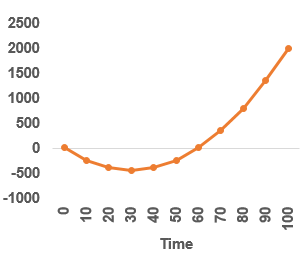
Which of the following functions correctly characterizes this trend?

a. Tr = 10 + 0.3*TIME + 0.3*TIME^2
b. Tr = 10 + 30*TIME - 0.3*TIME^2
c. Tr = 10 - 0.4*TIME - 0.4*TIME^2
d. Tr = 10 - 30*TIME + 0.5*TIME^2


699.2. You work for the International Monetary Fund in Washington DC, monitoring Singapore’s real consumption expenditures. Using a sample of real consumption data (measured in billions of 2005 Singapore dollars), y(t), t=1990:Q1, 1990:Q2, ... , 2006:Q3, 2006:Q4 where y(0) is 1990:Q2, you estimate the linear consumption trend model, y(t) = β(0) + β(1)*TIME(t) + e(i), where e(i) ~ N(0, σ^2), obtaining the estimates β(0) = 0.510, β(1) = 2.30, and σ^2 = 16. Based on your estimated trend model, which is nearest to the 95.0% interval forecast 2010:Q1? (source: Diebold's Question 5.1)

a. 39 to 54
b, 153 to 216
c. 177 to 192
d. 181 to 189


699.3. You would like to describe an account that begins at TIME(0) = $100.00 and compounds continuously at 9.0% per annum. What is a function that characterizes the value of this account, A(t), over time according to such a continuous and constant growth trend?

a. A(t) = $100*exp[0.090*TIME(t)]
b. ln[A(t)] = ln($100) + 0.09*TIME(t)
c. Neither (A) nor (B)
d. Both (A) and (B)

Answers here:
 
Last edited by a moderator:

David Harper CFA FRM

David Harper CFA FRM
Subscriber
This question is oddly numbered T2.699 because, as I just finished writing fresh Diebold time series questions, Nicole spotted that I overlooked GARP's two new LOs which appear at the start of the Diebold readings ("Describe linear and nonlinear trends. Describe trend models to estimate and forecast trends") . I did not want to confuse the continuity of our 7XX series, so this is meant to "retroactively" be inserted into the beginning of the new Diebold question set (our sausage-making won't require thinking on our part, in the PQ PDF that we are just about to publish to the Study Planner ;))

I can see why GARP added these two LOs. Last year, Diebold LOs began with this LO: "Compare and evaluate model selection criteria, including mean squared error (MSE), s2, the Akaike information criterion (AIC), and the Schwarz information criterion (SIC)." Hey, that is NOT easing anybody into time series with a graceful introduction :eek: ...

I think the Diebold time series material is among the hardest content in the P1 FRM, fwiw. It is compounded by GARP's anthology style wherein chapters (subsets) are assigned, so often it feels like you might need to know something from the excluded chapters. Or, the terminology for something like regression can vary slightly; e.g., explanatory and independent variables are synonyms but then Stock/Watson also calls them regressors (uggh, how many times will I be looking up "regressors" before I just remember!).

As usual, I think it's a question of your goals. A lot of folks just want to pass the exam and that's the goal. In which case, you can be pretty strategic and ruthless and somewhat shallow with respect to Diebold's time series.

On the other hand, if you seek real mastery (as I do), then my personal opinion is that time series (like several other domains or topics) cannot really be mastered without some exposure or immersion in software and actual data (e.g., Excel, python and/or R). Reading and writing text-based sentences simply cannot compel you to cope with the actual issues. I am not a time series expert! I just have visited the tip of the iceberg so that I can begin to appreciate its depth. My favorite technical text--which is the basis for most of my true understanding of the GARCH(p,q) model is Asset Price Dynamics, Volatility, and Prediction by Stephen Taylor (so many times this helped me solve a GARCH riddle!)

For software, my tool is R (https://www.r-project.org/) which is becoming the statistical tool of choice (the virtuous cycle of developers swarming with new packages daily). I love https://www.datacamp.com I'm on my 20th or 23rd course or something but with respect to time series:
 
Last edited:

Vaishnevi

New Member
Hi David,

Regarding the question:
699.2. You work for the International Monetary Fund in Washington DC, monitoring Singapore’s real consumption expenditures. Using a sample of real consumption data (measured in billions of 2005 Singapore dollars), y(t), t=1990:Q1, 1990:Q2, ... , 2006:Q3, 2006:Q4 where y(0) is 1990:Q2, you estimate the linear consumption trend model, y(t) = β(0) + β(1)*TIME(t) + e(i), where e(i) ~ N(0, σ^2), obtaining the estimates β(0) = 0.510, β(1) = 2.30, and σ^2 = 16. Based on your estimated trend model, which is nearest to the 95.0% interval forecast 2010:Q1? (source: Diebold's Question 5.1)

a. 39 to 54
b, 153 to 216
c. 177 to 192
d. 181 to 189

I saw that the answer is.............................. (deleted by Nicole, as answers & explanations are only available to paid members)

I was a bit confused as 2010 Q1 is 81 quarters. Is 1990 Q1- regarded as 0th quarter or 1st quarter? If 2010 Q1=81 quarters then the nearest answer is d:181 to 189.

Kindly help in understanding this question.
 
Last edited by a moderator:

Nicole Seaman

Director of CFA & FRM Operations
Staff member
Subscriber
Hi David,

Regarding the question:
699.2. You work for the International Monetary Fund in Washington DC, monitoring Singapore’s real consumption expenditures. Using a sample of real consumption data (measured in billions of 2005 Singapore dollars), y(t), t=1990:Q1, 1990:Q2, ... , 2006:Q3, 2006:Q4 where y(0) is 1990:Q2, you estimate the linear consumption trend model, y(t) = β(0) + β(1)*TIME(t) + e(i), where e(i) ~ N(0, σ^2), obtaining the estimates β(0) = 0.510, β(1) = 2.30, and σ^2 = 16. Based on your estimated trend model, which is nearest to the 95.0% interval forecast 2010:Q1? (source: Diebold's Question 5.1)

a. 39 to 54
b, 153 to 216
c. 177 to 192
d. 181 to 189

I saw that the answer is ............................................. (deleted by Nicole, as answers & explanations are not available to unpaid members)

I was a bit confused as 2010 Q1 is 81 quarters. Is 1990 Q1- regarded as 0th quarter or 1st quarter? If 2010 Q1=81 quarters then the nearest answer is d:181 to 189.

Kindly help in understanding this question.
Hello @Vaishnevi

The answers and explanations to our practice questions are only available to paid subscribers. If you were a paid subscriber, you would see that this has already been explained in the paid section of the forum here: https://forum.bionicturtle.com/threads/p1-t2-699-linear-and-nonlinear-trends-diebold.10149/. I checked your account, and there is no history of an order from you, so it looks like you are using pirated materials that were not purchased from us (which is illegal by the way). If you would like help with content questions that you have, you can purchase our materials here so you can gain access to our paid forum sections: https://www.bionicturtle.com/features-pricing-2/.

Thank you,

Nicole
 
Top