Learning objectives: Define and distinguish between volatility, variance rate, and implied volatility. Describe the power law. Explain how various weighting schemes can be used in estimating volatility.
Questions
702.1. Consider the following series of closing stock prices over the tend most recent trading day (this is similar to Hull's Table 10.3) along with daily log returns, squared returns and summary statistics:
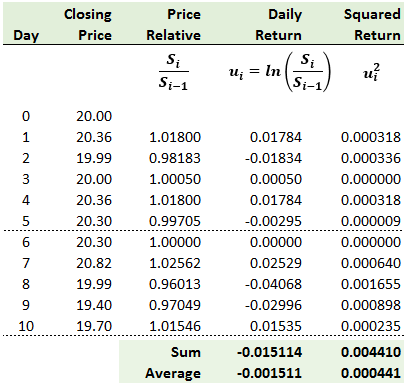
Although the actual average historical return is non-zero (ie, -0.001511), for purposes of estimating volatility we will assume that the expected daily mean return is zero. For the purpose of scaling the daily volatility to an annual volatility, we will further assume i.i.d. returns and 250 trading days per year. Which is nearest to the simple (ie, historical unweighted), unbiased per annum volatility estimate?
a. 5.0% per annum
b. 15.0%
c. 25.0%
d. 35.0%
702.2. The number of visitors to a retail bank branch follows the power law (Hull 10.1) where Prob(v > X) = k*X^(-α) with α = 2.0. Suppose that 5.0% of branches get 500 or more visitors per day. What percentage of branches get 2,000 or more visitors per day?
a. 0.3125%
b. 1.000%
c. 1.250%
d. 2.625%
702.3. Your colleague Robert is estimating the daily volatility of your firm's traded stock price based on this formula for the variance rate
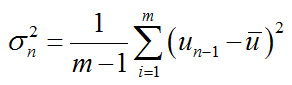
However, he wants to employ a few simplifications to his estimate of simple daily historical volatility. Each of the following simplifying assumptions is acceptable EXCEPT which is likely a mistake?
a. He is going to assume the expected (mean) return is zero
b. He is going to multiply the summation by 1/m instead of 1/(m-1)
c. Instead of summing the squared returns, he is going to sum returns (without squaring)
d. For the returns, u(i), he replaces log returns, ln[S(i)/S(i-1)], with simple returns, S(i)/S(i-1)-1
Answers here:
Questions
702.1. Consider the following series of closing stock prices over the tend most recent trading day (this is similar to Hull's Table 10.3) along with daily log returns, squared returns and summary statistics:
Although the actual average historical return is non-zero (ie, -0.001511), for purposes of estimating volatility we will assume that the expected daily mean return is zero. For the purpose of scaling the daily volatility to an annual volatility, we will further assume i.i.d. returns and 250 trading days per year. Which is nearest to the simple (ie, historical unweighted), unbiased per annum volatility estimate?
a. 5.0% per annum
b. 15.0%
c. 25.0%
d. 35.0%
702.2. The number of visitors to a retail bank branch follows the power law (Hull 10.1) where Prob(v > X) = k*X^(-α) with α = 2.0. Suppose that 5.0% of branches get 500 or more visitors per day. What percentage of branches get 2,000 or more visitors per day?
a. 0.3125%
b. 1.000%
c. 1.250%
d. 2.625%
702.3. Your colleague Robert is estimating the daily volatility of your firm's traded stock price based on this formula for the variance rate
However, he wants to employ a few simplifications to his estimate of simple daily historical volatility. Each of the following simplifying assumptions is acceptable EXCEPT which is likely a mistake?
a. He is going to assume the expected (mean) return is zero
b. He is going to multiply the summation by 1/m instead of 1/(m-1)
c. Instead of summing the squared returns, he is going to sum returns (without squaring)
d. For the returns, u(i), he replaces log returns, ln[S(i)/S(i-1)], with simple returns, S(i)/S(i-1)-1
Answers here:
Last edited by a moderator: