Learning objectives: Interpret and apply the mean, standard deviation, and variance of a random variable. Calculate the mean, standard deviation, and variance of a discrete random variable. Interpret and calculate the expected value of a discrete random variable.
Questions:
710.1. The following probability matrix contains the joint probabilities for random variables X = {2, 7, or 12} and Y = {1, 3, or 5}:

We are informed that (X) and (Y) are independent. What is the expected value of the product of X and Y, E(X*Y)?
a. 15.0
b. 21.0
c. 30.5
d. 35.0
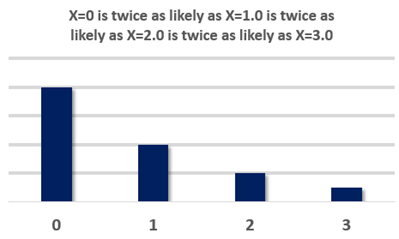
710.2. Peter is running the first draft of a Monte Carlo simulation and he wants a simple random variable to capture the loss frequency per week (i.e., the number of loss events) associated with a operational process. As he is just experimenting with his model, he does not have a probability density function in mind. Instead, he has a simple rule-based idea that he wants to express in a probability function. The number of losses per week will be either zero, one, two or three; X = {0, 1, 2, or 3}. An outcome of X = 3.0 is the least likely; an outcome of X = 2.0 is twice as likely as X = 3.0; an outcome of X = 1.0 is twice as likely as X = 2.0, and finally an outcome of X = zero is twice as likely as X = 1.0. This is illustrated below:

Assuming this qualifies as a probability distribution, which is nearest to the standard deviation of this random variable?
a. Zero
b. 0.625
c. 0.750
d. 0.930
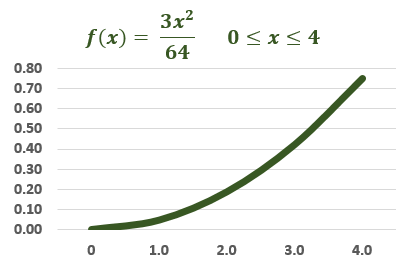
710.3. Consider a random variable that represents the loss severity of a risky asset and is given by the continuous probability distribution f(x) = 3*x^2/64 on the domain from zero to four:

What are this variable's mean and variance?
a. µ = 1.0 and σ^2 = 3.50
b. µ = 2.0 and σ^2 = 2.75
c. µ = 3.0 and σ^2 = 0.60
d. µ = 3.6 and σ^2 = 0.25
Answers here:
Questions:
710.1. The following probability matrix contains the joint probabilities for random variables X = {2, 7, or 12} and Y = {1, 3, or 5}:

We are informed that (X) and (Y) are independent. What is the expected value of the product of X and Y, E(X*Y)?
a. 15.0
b. 21.0
c. 30.5
d. 35.0
710.2. Peter is running the first draft of a Monte Carlo simulation and he wants a simple random variable to capture the loss frequency per week (i.e., the number of loss events) associated with a operational process. As he is just experimenting with his model, he does not have a probability density function in mind. Instead, he has a simple rule-based idea that he wants to express in a probability function. The number of losses per week will be either zero, one, two or three; X = {0, 1, 2, or 3}. An outcome of X = 3.0 is the least likely; an outcome of X = 2.0 is twice as likely as X = 3.0; an outcome of X = 1.0 is twice as likely as X = 2.0, and finally an outcome of X = zero is twice as likely as X = 1.0. This is illustrated below:

Assuming this qualifies as a probability distribution, which is nearest to the standard deviation of this random variable?
a. Zero
b. 0.625
c. 0.750
d. 0.930
710.3. Consider a random variable that represents the loss severity of a risky asset and is given by the continuous probability distribution f(x) = 3*x^2/64 on the domain from zero to four:

What are this variable's mean and variance?
a. µ = 1.0 and σ^2 = 3.50
b. µ = 2.0 and σ^2 = 2.75
c. µ = 3.0 and σ^2 = 0.60
d. µ = 3.6 and σ^2 = 0.25
Answers here:
Last edited by a moderator:
