Learning Objectives: Distinguish the key properties among the following distributions: ... Chi-squared distribution, Student’s t, and F-distributions.
Questions:
For the following questions, please rely on the statistical lookup tables provided here http://trtl.bz/T2-715-lookup-tables. This document contains four lookup tables (note that each also contains an example): cumulative standard normal distribution, student's t distribution, chi-squared distribution, and F distribution.
715.1. A new equity fund called MachineTradeBet is managed by an artificially intelligent bot who utilizes machine learning. The fund claims that its true (population) volatility does not exceed 15.0% per annum. However, based on a random sample of 40 observations, a sample volatility of 17.0% per annum is calculated. The desired confidence level is 95.0%; further this is a one-side test as the null hypothesis assumes the volatility is equal to, or less than, 15.0% per annum. Should the null hypothesis be rejected, in favor of the alternative hypothesis which asserts that the fund's true volatility exceeds 15.0%?
a. No, because the test statistic of 50.09 is less than the critical value of 54.57
b. No, because the test statistic of 44.20 is less than the critical value of 55.76
c. Yes, because the test statistic of 45.33 is less than the critical value of 58.12
d. Yes, because the test statistic of 51.38 is less than the critical value of 59.34
715.2. Henry's firm is contemplating a switch from spreadsheets to data analytics software primarily because his firm's risk managers believe that the spreadsheets are responsible for too many errors. Certain members of the finance staff function, however, disagree; the hypothesis of these "Excel sympathizers" is that the firm's current spreadsheets contain no more than one bug per sheet. To test their hypothesis, a sample of 36 sheets is carefully analyzed. The sample mean is 1.50 bugs per sheet with a (sample) standard deviation of 0.90. If the desired confidence level is 95.0%, should Henry reject the null hypothesis that the true error rate is not greater than 1.0 bug per sheet?
a. Yes, because the test statistic of 3.33 is greater than the critical value of 1.690
b. Yes, because the test statistic of 10.0 is greater than the critical value of 2.030
c. No, because the test statistic of 10.0 is less than the critical value of 12.706
d. Because the population distribution and variance are both unknown, we do not have a reliable test statistic for the sample mean
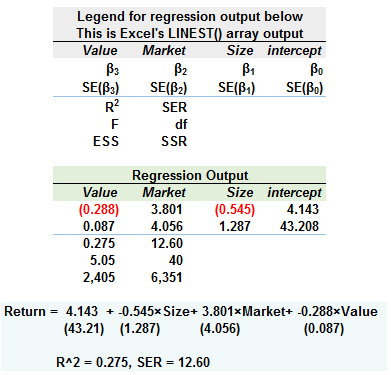
715.3. In order to explore the Fama-French three-factor model, Debra regressed a fund's excess return against three variables: value, market, and size. The sample includes 44 observations. The regression output is shown below; for example, the partial slope coefficient of the Market variable is 3.801 with a standard error of 4.056, and the coefficient of determination (R^2) is 0.275.
As the sample size is 44 observations, the degrees of freedom are:
a. She accepts the null because the F-statistic of 5.05 is less than 5.99 which is the critical value associated with F(df1 = 4, df2 = 10)
b. She accepts the null because the R^2 of 0.275 is less than 2.84 which is the critical value associated with F(df1 = 1, df2 = 40)
c. She rejects the null because the F-statistic of 5.05 is greater than 2.84 which is the critical value associated with F(df1 = 3, df2 = 40)
d. She rejects the null because the R^2 of 0.275 is greater than 0.2254 which is the critical value given by the F-value of 2.84 divided by the SER of 12.60
Answers here:
Questions:
For the following questions, please rely on the statistical lookup tables provided here http://trtl.bz/T2-715-lookup-tables. This document contains four lookup tables (note that each also contains an example): cumulative standard normal distribution, student's t distribution, chi-squared distribution, and F distribution.
715.1. A new equity fund called MachineTradeBet is managed by an artificially intelligent bot who utilizes machine learning. The fund claims that its true (population) volatility does not exceed 15.0% per annum. However, based on a random sample of 40 observations, a sample volatility of 17.0% per annum is calculated. The desired confidence level is 95.0%; further this is a one-side test as the null hypothesis assumes the volatility is equal to, or less than, 15.0% per annum. Should the null hypothesis be rejected, in favor of the alternative hypothesis which asserts that the fund's true volatility exceeds 15.0%?
a. No, because the test statistic of 50.09 is less than the critical value of 54.57
b. No, because the test statistic of 44.20 is less than the critical value of 55.76
c. Yes, because the test statistic of 45.33 is less than the critical value of 58.12
d. Yes, because the test statistic of 51.38 is less than the critical value of 59.34
715.2. Henry's firm is contemplating a switch from spreadsheets to data analytics software primarily because his firm's risk managers believe that the spreadsheets are responsible for too many errors. Certain members of the finance staff function, however, disagree; the hypothesis of these "Excel sympathizers" is that the firm's current spreadsheets contain no more than one bug per sheet. To test their hypothesis, a sample of 36 sheets is carefully analyzed. The sample mean is 1.50 bugs per sheet with a (sample) standard deviation of 0.90. If the desired confidence level is 95.0%, should Henry reject the null hypothesis that the true error rate is not greater than 1.0 bug per sheet?
a. Yes, because the test statistic of 3.33 is greater than the critical value of 1.690
b. Yes, because the test statistic of 10.0 is greater than the critical value of 2.030
c. No, because the test statistic of 10.0 is less than the critical value of 12.706
d. Because the population distribution and variance are both unknown, we do not have a reliable test statistic for the sample mean
715.3. In order to explore the Fama-French three-factor model, Debra regressed a fund's excess return against three variables: value, market, and size. The sample includes 44 observations. The regression output is shown below; for example, the partial slope coefficient of the Market variable is 3.801 with a standard error of 4.056, and the coefficient of determination (R^2) is 0.275.
As the sample size is 44 observations, the degrees of freedom are:
- The total sum of squares (TSS) has 43 degrees of freedom (d.f.) which is given by (n - 1) = 44 - 1 = 43;
- The residual sum of squares (RSS) has 40 d.f. which is given by (n - 4) = 44 - 4 = 40;
- The explained sum of squares (ESS) has 3 d.f. due to the estimation of three partial slope coefficients
a. She accepts the null because the F-statistic of 5.05 is less than 5.99 which is the critical value associated with F(df1 = 4, df2 = 10)
b. She accepts the null because the R^2 of 0.275 is less than 2.84 which is the critical value associated with F(df1 = 1, df2 = 40)
c. She rejects the null because the F-statistic of 5.05 is greater than 2.84 which is the critical value associated with F(df1 = 3, df2 = 40)
d. She rejects the null because the R^2 of 0.275 is greater than 0.2254 which is the critical value given by the F-value of 2.84 divided by the SER of 12.60
Answers here: