Learning objectives: Describe the volatility smile for equity options and foreign currency options and provide possible explanations for its shape. Describe alternative ways of characterizing the volatility smile. Describe volatility term structures and volatility surfaces and how they may be used to price options. Explain the impact of the volatility smile on the calculation of an option’s Greek letter risk measures. Explain the impact of a single asset price jump on a volatility smile.
Questions:
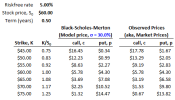
23.7.1. Your colleague Peter asserts that the empirically observed tendency is a negative correlation between equity prices and volatility (we'll call this Peter's empirical observation). Below are displayed call and put option prices at various strike prices, from K = $45.00 to K = $75.00 in $5.00 increments. All of the options have six-month terms, and the underlying stock has a current price of $60.00. There are two sets of prices: the first set price the options with the Black-Scholes-Merton assuming volatility, σ = 30.0%. The second set is the observed (aka, market) prices.

What is the shape of the implied volatility smile, and is it consistent with Peter's empirical observation?
a. The shape is an upward-sloping smirk (aka, skew), and it is consistent with Peter's empirical observation
b. The shape is a downward-sloping smirk (aka, skew), and it is consistent with Peter's empirical observation
c. The shape is a smile, but it is not consistent with Peter's empirical observation
d. The shape is a frown, but it is not consistent with Peter's empirical observation
23.7.2. The riskfree rate is 5.0% while the current stock price is $80.00. Two most liquid options both have a strike price of $70.00 such that the ratio K/S(0) = 0.90. In addition to the same strike price, both options have the same maturity of three months, T = 0.25 years. The implied volatility of the call is 30.0%, and the implied volatility of the put is 38.0%. What is the trade that exploits this scenario, if any?
a. Buy call, sell put, and short the stock
b. Buy put, sell call, and buy the stock
c. Buy the call, buy the put, and short a straddle
d. Sell the call, sell the put, and buy a straddle
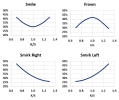
23.7.3. Let's assume the following pithy labels (smile, frown, smirk right, and smirk right) in order to refer to the four archetypal shapes of the implied volatility curve, as graphed below:

Consider the following four scenarios:
I. Asset volatility is positively correlated with the asset's price
II. The underlying asset's price distribution has a heavy left tail and a thin (aka, light) right tail
III. The underlying is a foreign exchange rate that trades within a very narrow band due to central bank policy
IV. The option matures in one week, and--due to an expected announcement--the underlying stock will exhibit a single large jump: either up or down by >16% within the week
Which implied volatility shape corresponds to these scenarios?
a. I. Smile, II. Smirk Left, III. Smirk Right, IV. Smile
b. I. Smile, II. Frown, III. Smirk Right, IV. Frown
c. I. Smirk Left, II. Smirk Right, III. Frown, IV. Frown
d. I. Smirk Left, II. Smirk Left, III. Smile, IV. Smile
Answers here:
Questions:
23.7.1. Your colleague Peter asserts that the empirically observed tendency is a negative correlation between equity prices and volatility (we'll call this Peter's empirical observation). Below are displayed call and put option prices at various strike prices, from K = $45.00 to K = $75.00 in $5.00 increments. All of the options have six-month terms, and the underlying stock has a current price of $60.00. There are two sets of prices: the first set price the options with the Black-Scholes-Merton assuming volatility, σ = 30.0%. The second set is the observed (aka, market) prices.

What is the shape of the implied volatility smile, and is it consistent with Peter's empirical observation?
a. The shape is an upward-sloping smirk (aka, skew), and it is consistent with Peter's empirical observation
b. The shape is a downward-sloping smirk (aka, skew), and it is consistent with Peter's empirical observation
c. The shape is a smile, but it is not consistent with Peter's empirical observation
d. The shape is a frown, but it is not consistent with Peter's empirical observation
23.7.2. The riskfree rate is 5.0% while the current stock price is $80.00. Two most liquid options both have a strike price of $70.00 such that the ratio K/S(0) = 0.90. In addition to the same strike price, both options have the same maturity of three months, T = 0.25 years. The implied volatility of the call is 30.0%, and the implied volatility of the put is 38.0%. What is the trade that exploits this scenario, if any?
a. Buy call, sell put, and short the stock
b. Buy put, sell call, and buy the stock
c. Buy the call, buy the put, and short a straddle
d. Sell the call, sell the put, and buy a straddle
23.7.3. Let's assume the following pithy labels (smile, frown, smirk right, and smirk right) in order to refer to the four archetypal shapes of the implied volatility curve, as graphed below:

Consider the following four scenarios:
I. Asset volatility is positively correlated with the asset's price
II. The underlying asset's price distribution has a heavy left tail and a thin (aka, light) right tail
III. The underlying is a foreign exchange rate that trades within a very narrow band due to central bank policy
IV. The option matures in one week, and--due to an expected announcement--the underlying stock will exhibit a single large jump: either up or down by >16% within the week
Which implied volatility shape corresponds to these scenarios?
a. I. Smile, II. Smirk Left, III. Smirk Right, IV. Smile
b. I. Smile, II. Frown, III. Smirk Right, IV. Frown
c. I. Smirk Left, II. Smirk Right, III. Frown, IV. Frown
d. I. Smirk Left, II. Smirk Left, III. Smile, IV. Smile
Answers here:
