Learning objective: Differentiate among the three methods of mapping portfolios of fixed income securities.
Questions:
715.1. Consider a $200.00 million portfolio that is equally allocated between two bonds: the first bond pays a 5.0% annual coupon and matures in five years; the second bond pays a 3.0% annual coupon and matures in three years. Both bonds are currently priced at par, so their market value is $100.00 million each. The spot rate term structure is depicted below: 1.20% at one year, 2.00% at two years, 3.04% at three years, 4.50% at four years and 5.20% at five years. Finally, the returns VaR (aka, risk) is based on a yield volatility of 100 basis points at all maturities and a confidence level of 99.0%. In this way, for example, the risk at one year is given by 1.0%*2.33*(1/1.0120) = 2.30%, and the risk at two years is given by 1.0%*2.33*(2/1.020) = 4.57%.
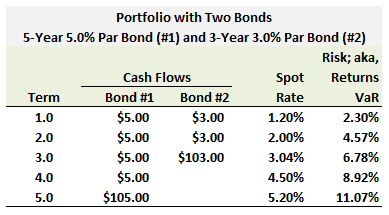
Please note that compound frequency is annual, following the annual coupon payment. Under the principal mapping approach, which is nearest to the portfolio value at risk (VaR)?
a. $13.00 million
b. $14.67 million
c. $17.84 million
d. $23.05 million
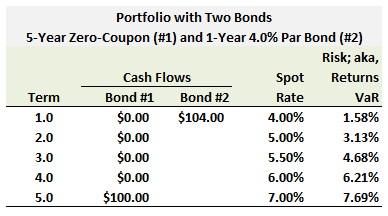
715.2. A portfolio with a current value of $171.30 million is allocated between two bonds:
Please note that compound frequency is annual, following the annual coupon payment. Under the duration mapping approach, which is nearest to the portfolio value at risk (VaR)?
a. $6.555 million
b. $8.034 million
c. $10.633 million
d. $13.960 million
715.3. Consider a $200.00 million portfolio that is equally allocated between two bonds:
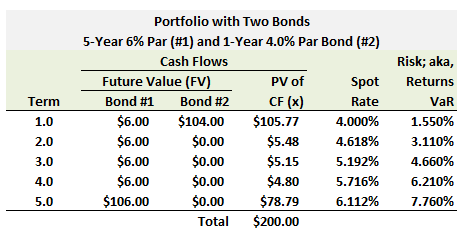
The exhibit above displays the spot rate term structure and assumptions for risk (aka, returns VaR) at each maturity (these assumptions mostly follow Jorion's own example in Chapter 11 EXCEPT the underling set of yield VaR assumptions have been increased). (Philippe Jorion, Value-at-Risk: The New Benchmark for Managing Financial Risk, 3rd Edition (New York: McGraw Hill, 2006))
Please note that compound frequency is annual, following the annual coupon payment. If we utilize the cash flow mapping approach, which of the following is TRUE about the resultant portfolio value at risk (VaR)?
a. The portfolio is mapped to a single risk factor which in this case is the sum of the present value of all cash flows (i.e., $200.00 million) such that the portfolio VaR is approximately $200.00 * 7.760% = $15.52 million
b. The future cash flows are mapped to the five term-structure vertices such that the portfolio VaR is approximately ($110.00 * 1.554%) + ($6.00 * 3.112%) + ($6.00 * 4.664%) + ($6.00 * 6.214%) + ($106.00 * 7.762%) = $10.78
c. The present value cash flows are mapped to the five term-structure vertices such that portfolio VaR is approximately ($105.77 * 1.554%) + ($5.48 * 3.112%) + ($5.15 * 4.664%) + ($4.80 * 6.214%) + ($78.79 * 7.762%) = $8.4620 and we can call this the "diversified" portfolio VaR because the cash-flow mapping employs all five risk risk factors
d. The present value cash flows are mapped to the five term-structure vertices such that portfolio VaR is approximately ($105.77 * 1.554%) + ($5.48 * 3.112%) + ($5.15 * 4.664%) + ($4.80 * 6.214%) + ($78.79 * 7.762%) = $8.4620 however this is the "undiversified" portfolio VaR
Answers here:
Questions:
715.1. Consider a $200.00 million portfolio that is equally allocated between two bonds: the first bond pays a 5.0% annual coupon and matures in five years; the second bond pays a 3.0% annual coupon and matures in three years. Both bonds are currently priced at par, so their market value is $100.00 million each. The spot rate term structure is depicted below: 1.20% at one year, 2.00% at two years, 3.04% at three years, 4.50% at four years and 5.20% at five years. Finally, the returns VaR (aka, risk) is based on a yield volatility of 100 basis points at all maturities and a confidence level of 99.0%. In this way, for example, the risk at one year is given by 1.0%*2.33*(1/1.0120) = 2.30%, and the risk at two years is given by 1.0%*2.33*(2/1.020) = 4.57%.
Please note that compound frequency is annual, following the annual coupon payment. Under the principal mapping approach, which is nearest to the portfolio value at risk (VaR)?
a. $13.00 million
b. $14.67 million
c. $17.84 million
d. $23.05 million
715.2. A portfolio with a current value of $171.30 million is allocated between two bonds:
- The first bond is a zero-coupon bond with five years to maturity and it has a value of $71.40 million. Its annual yield to maturity is 7.0% as 1/1.07^5 equals about 0.7130;
- The second bond matures in one year and pays a 4.0% annual coupon. It has a yield of 4.0% such that its market value is $100.00 million
Please note that compound frequency is annual, following the annual coupon payment. Under the duration mapping approach, which is nearest to the portfolio value at risk (VaR)?
a. $6.555 million
b. $8.034 million
c. $10.633 million
d. $13.960 million
715.3. Consider a $200.00 million portfolio that is equally allocated between two bonds:
- The first $100.00 million bond pays a 6.0% annual coupon and matures in five years. It is priced at par (its annual yield is therefore 6.0%)
- The second $100.00 million bond pays a 4.0% annual coupon and matures in one years. It is priced at par (its annual yield is therefore 4.0%)
The exhibit above displays the spot rate term structure and assumptions for risk (aka, returns VaR) at each maturity (these assumptions mostly follow Jorion's own example in Chapter 11 EXCEPT the underling set of yield VaR assumptions have been increased). (Philippe Jorion, Value-at-Risk: The New Benchmark for Managing Financial Risk, 3rd Edition (New York: McGraw Hill, 2006))
Please note that compound frequency is annual, following the annual coupon payment. If we utilize the cash flow mapping approach, which of the following is TRUE about the resultant portfolio value at risk (VaR)?
a. The portfolio is mapped to a single risk factor which in this case is the sum of the present value of all cash flows (i.e., $200.00 million) such that the portfolio VaR is approximately $200.00 * 7.760% = $15.52 million
b. The future cash flows are mapped to the five term-structure vertices such that the portfolio VaR is approximately ($110.00 * 1.554%) + ($6.00 * 3.112%) + ($6.00 * 4.664%) + ($6.00 * 6.214%) + ($106.00 * 7.762%) = $10.78
c. The present value cash flows are mapped to the five term-structure vertices such that portfolio VaR is approximately ($105.77 * 1.554%) + ($5.48 * 3.112%) + ($5.15 * 4.664%) + ($4.80 * 6.214%) + ($78.79 * 7.762%) = $8.4620 and we can call this the "diversified" portfolio VaR because the cash-flow mapping employs all five risk risk factors
d. The present value cash flows are mapped to the five term-structure vertices such that portfolio VaR is approximately ($105.77 * 1.554%) + ($5.48 * 3.112%) + ($5.15 * 4.664%) + ($4.80 * 6.214%) + ($78.79 * 7.762%) = $8.4620 however this is the "undiversified" portfolio VaR
Answers here:
Last edited: