Fran
Administrator
Questions:
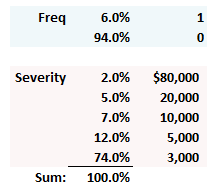
307.1. Analyst Sally develops the following model for her bank's daily operational risk losses, which includes the assumption that the daily frequency is a Bernoulli with probability of only 6.0% (several minor losses are expected but model ignores losses below $3,000) and, further, an assumption that loss frequency and severity are independent:

Which is nearest to the estimate of daily unexpected loss (UL) with 99.0% confidence?
a. $2,017
b. $4,633
c. $9,754
d. $20,000
307.2. Peter is using the loss distribution approach (LDA) and he is trying to select a distribution for the severity of his bank's operation losses. He will be calibrating his model, consistent with Basel, at 99.9% confidence over a one year horizon. Each of the following is at least plausible, but which of the following is LEAST likely to be true about this selection?
a. The severity distribution is a single empirical distribution (body and tail) without extrapolation beyond internal data
b. The severity distribution is sub-exponential
c. The severity distribution is lognormal or Weibull or Generalized Pareto (GPD using POT)
d. The severity distribution is piecewise; i.e., the body uses a different distribution than the tail
307.3. Randy has collected internal data from his bank in order to calibrate operational loss severity and frequency distributions. He decides that he will not complement his dataset with external data, although he is concerned that the bank's IT systems may not have captured many of the high-frequency, low-severity (HFLS) losses. Therefore, he is likely to encounter each of the following biases or problems, EXCEPT which is he LEAST likely to encounter if he relies solely on this internal data?
a. Survivorship bias
b. Truncation bias
c. Scale bias
d. Data insufficiency problem
Answers:
307.1. Analyst Sally develops the following model for her bank's daily operational risk losses, which includes the assumption that the daily frequency is a Bernoulli with probability of only 6.0% (several minor losses are expected but model ignores losses below $3,000) and, further, an assumption that loss frequency and severity are independent:

Which is nearest to the estimate of daily unexpected loss (UL) with 99.0% confidence?
a. $2,017
b. $4,633
c. $9,754
d. $20,000
307.2. Peter is using the loss distribution approach (LDA) and he is trying to select a distribution for the severity of his bank's operation losses. He will be calibrating his model, consistent with Basel, at 99.9% confidence over a one year horizon. Each of the following is at least plausible, but which of the following is LEAST likely to be true about this selection?
a. The severity distribution is a single empirical distribution (body and tail) without extrapolation beyond internal data
b. The severity distribution is sub-exponential
c. The severity distribution is lognormal or Weibull or Generalized Pareto (GPD using POT)
d. The severity distribution is piecewise; i.e., the body uses a different distribution than the tail
307.3. Randy has collected internal data from his bank in order to calibrate operational loss severity and frequency distributions. He decides that he will not complement his dataset with external data, although he is concerned that the bank's IT systems may not have captured many of the high-frequency, low-severity (HFLS) losses. Therefore, he is likely to encounter each of the following biases or problems, EXCEPT which is he LEAST likely to encounter if he relies solely on this internal data?
a. Survivorship bias
b. Truncation bias
c. Scale bias
d. Data insufficiency problem
Answers:
