Learning outcomes: Describe the loss distribution approach to modeling operational risk capital. Explain how frequency and severity distributions of operational losses are obtained, including commonly used distributions and suitability guidelines for probability distributions. Explain how Monte Carlo simulation can be used to generate additional data points to estimate the 99.9th percentile of an operational loss distribution. Explain the use of scenario analysis and the hybrid approach in modeling operational risk capital. Describe the AMA guidelines for the use of insurance in reducing a bank’s operational risk capital charge.
Questions:
505.1. Under the loss distribution approach (LDA) to modeling operational risk capital, with respect to modeling frequency Girling writes, "In order to develop a model of expected operational risk losses, the first step is to determine the likely number of events per year. This is the frequency of events. The most popular distribution selection for modeling frequency is the Poisson distribution. This allows for a fairly simple approach to modeling frequency. In a Poisson distribution there is only a single parameter (λ), which represents the average number of events in a given year. Both the mean and the variance are represented by this single parameter in a Poisson distribution. In more complex cases, a negative binomial distribution may be used, which allows for different values for the mean and variance."
Consider the following plot of three Poisson distributions:
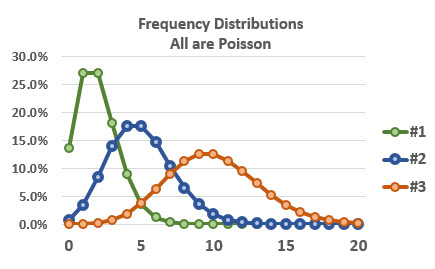
About these three Poisson distributions, each of the following is true EXCEPT which is false?
a. Distribution One (#1) has the highest skew and highest kurtosis
b. Distribution Three (#3) has the highest mean and highest variance
c. Distribution Three (#3) most nearly approximates a normal distribution
d. The probability of an outcome less than or equal to five, Pr[X ≤ 5], is highest for Distribution Two (#2)
505.2. Under the loss distribution approach (LDA), Girling says the first step is to model frequency. The next step (Step #2) is to model severity: "The next step in modeling expected operational risk losses is to determine the likely size of an event given the fact that an event has occurred. This is the severity of an event. Unlike frequency, severity need not be an integer, but can fall anywhere along a continuum. When a loss occurs it might be $ 1.50 or it might be $ 133,892.25 or any other value. The severity distribution establishes the probability of an event occurring over a wide range of values, from zero to very, very large losses."
According to Girling, each of the following statements is true about the severity distribution EXCEPT which is false?
a. Regulators take a keen interest in how well the selected distribution demonstrates “goodness of fit;” i.e., how certain are we that the sample comes from the population with the claimed distribution
b. In addition to "goodness of fit," a suitable severity model should probably meet the following criteria: realistic, well-specified, flexible, and simple
c. Whichever distribution is selected, the probability density function for severity will have light (thin) tails and will also be skewed to the left
d. The most common and least complex approach to modeling severity is to use a lognormal distribution, although low frequency losses may fit better to other options such as Generalized Gamma, Transformed Beta, Generalized Pareto, or Weibull
505.3. Under the loss distribution approach (LDA), Girling says the third step, after modeling frequency and severity, is Monte Carlos Simulation: "Step 3: Monte Carlo Simulation Once the frequency and severity distributions have been established, the next step is to use these distributions to generate many more data points in order to better estimate the capital needed to ensure with 99.9 percent certainty that likely losses for the next year are covered by appropriate capital. Monte Carlo simulation provides a method by which frequency and severity distributions can be combined to produce many more data points that have the same characteristics as the observed data points. Excel can handle this process using built in functionality, but often much more powerful statistical modeling tools are used."
About this third step, each of the following is true EXCEPT which is false?
a. A calculation must be done for each risk category. Capital must be allocated to the business lines appropriately.
b. Any insurance policy, including through captives and affiliates, mitigates the capital charge by up to 80%
c. In the operational risk capital matrix, correlation assumptions between cells can be used but they must be strongly defended
d. Whatever approach is taken to modeling capital for operational risk, the model must be stress tested and back tested for validity; the validity and verification requirements must be applied to all modeling activities and a special model validation team is usually established in order to meet those needs.
Answers here:
Questions:
505.1. Under the loss distribution approach (LDA) to modeling operational risk capital, with respect to modeling frequency Girling writes, "In order to develop a model of expected operational risk losses, the first step is to determine the likely number of events per year. This is the frequency of events. The most popular distribution selection for modeling frequency is the Poisson distribution. This allows for a fairly simple approach to modeling frequency. In a Poisson distribution there is only a single parameter (λ), which represents the average number of events in a given year. Both the mean and the variance are represented by this single parameter in a Poisson distribution. In more complex cases, a negative binomial distribution may be used, which allows for different values for the mean and variance."
Consider the following plot of three Poisson distributions:
About these three Poisson distributions, each of the following is true EXCEPT which is false?
a. Distribution One (#1) has the highest skew and highest kurtosis
b. Distribution Three (#3) has the highest mean and highest variance
c. Distribution Three (#3) most nearly approximates a normal distribution
d. The probability of an outcome less than or equal to five, Pr[X ≤ 5], is highest for Distribution Two (#2)
505.2. Under the loss distribution approach (LDA), Girling says the first step is to model frequency. The next step (Step #2) is to model severity: "The next step in modeling expected operational risk losses is to determine the likely size of an event given the fact that an event has occurred. This is the severity of an event. Unlike frequency, severity need not be an integer, but can fall anywhere along a continuum. When a loss occurs it might be $ 1.50 or it might be $ 133,892.25 or any other value. The severity distribution establishes the probability of an event occurring over a wide range of values, from zero to very, very large losses."
According to Girling, each of the following statements is true about the severity distribution EXCEPT which is false?
a. Regulators take a keen interest in how well the selected distribution demonstrates “goodness of fit;” i.e., how certain are we that the sample comes from the population with the claimed distribution
b. In addition to "goodness of fit," a suitable severity model should probably meet the following criteria: realistic, well-specified, flexible, and simple
c. Whichever distribution is selected, the probability density function for severity will have light (thin) tails and will also be skewed to the left
d. The most common and least complex approach to modeling severity is to use a lognormal distribution, although low frequency losses may fit better to other options such as Generalized Gamma, Transformed Beta, Generalized Pareto, or Weibull
505.3. Under the loss distribution approach (LDA), Girling says the third step, after modeling frequency and severity, is Monte Carlos Simulation: "Step 3: Monte Carlo Simulation Once the frequency and severity distributions have been established, the next step is to use these distributions to generate many more data points in order to better estimate the capital needed to ensure with 99.9 percent certainty that likely losses for the next year are covered by appropriate capital. Monte Carlo simulation provides a method by which frequency and severity distributions can be combined to produce many more data points that have the same characteristics as the observed data points. Excel can handle this process using built in functionality, but often much more powerful statistical modeling tools are used."
About this third step, each of the following is true EXCEPT which is false?
a. A calculation must be done for each risk category. Capital must be allocated to the business lines appropriately.
b. Any insurance policy, including through captives and affiliates, mitigates the capital charge by up to 80%
c. In the operational risk capital matrix, correlation assumptions between cells can be used but they must be strongly defended
d. Whatever approach is taken to modeling capital for operational risk, the model must be stress tested and back tested for validity; the validity and verification requirements must be applied to all modeling activities and a special model validation team is usually established in order to meet those needs.
Answers here: