P2.T8. Liquidity and Treasury Risk Measurement and Management

DenisAmbrosov

New Member
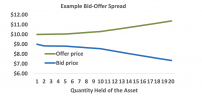
I am not sure about the offer price... When the financial institution tries to liquidate the large position [n] let's say n > 10, the spread widens. I understand why the bid price widens, as there is a surplus, a lot of supply in the market. But I can't get why the offer price widens.
 

Attachments

  • Screenshot 2022-02-06 at 19.56.14.png
    Screenshot 2022-02-06 at 19.56.14.png
    31.1 KB · Views: 3

David Harper CFA FRM

David Harper CFA FRM
Subscriber
Hi @DenisAmbrosov I love thoughtful questions like this. For me, the decreasing bid (as a function of quantity) is also intuitive because I can reference the natural ability to seek "volume discounts": I'm willing to buy (bid) 100 shares at $20.00, but if you want me to buy 1,000 shares, then I want a volume "discount" such that I'll pay up to $19.00. In this way, isn't the bid plot just the downward-sloping DEMAND curve in a typical economic supply/demand graph?

If you accept that, isn't the offer plot just associated the upward-sloping SUPPLY curve. True they don't intersect, and setting aside convexity/elasticity/curvature, isn't the offer plotting the willingness to sell greater quantities at higher prices? I will sell (ask) 100 shares for $21.00, but if I can sell for $23.00, I'll willing to liquidate more shares. I'm thinking about this now in regard to my largest position in COUR, where it actually depends on whether I'm in the money. I'm underwater at the moment. But let's say I'm suddenly in the money +50% with 1,000 COUR shares (making this up). I would TRIM by selling 100 shares, but I need a higher price to exit 50% or 100% of the position. What do you think? I haven't convinced myself totally because the volume discount seems to go the other way: If I want to liquidate all 1,000 COUR shares, then to induce a purchase, I need to offer a lower price, not a higher price. So I'm not either convinced this Hull's upward-sloping offer is universal truth. More later if i can find it ... Thanks,
 
Last edited:

David Harper CFA FRM

David Harper CFA FRM
Subscriber
Hi @DenisAmbrosov I was chatting with my colleague Richie who raised an excellent point (and question). We edited the X-axis from the (source Hull, as you know) "Quantity Transacted" to "Quantity Held," although my author on this is super smart and may have had a reason. Hull's text is
The general nature of the relationship between bid quotes, offer quotes, and trade size is indicated in Figure 24.1. The bid price tends to decrease and the offer price tends to increase with the size of a trade. For an instrument where there is a market maker, the bids and offers are the same up to the market maker’s size limit and then start to diverge.
I'm going to add two possible explanations:
  • To my colleague's inventory point: to the extent shares (available) for sale are inventory held, and if inventory has value (aka, negative storage cost; e.g., to supply in short sales, to delta hedge option writing), then marginal offer price logically increases as the inventory is depleted. Put simply, if I do value my dry powder, you will need to give me more to buy entire keg of it!
  • The limit order book perspective: as you may know, the order book is not a single bid ask, but a stack of limit bids and asks. On the ask stack side, the average price is an increasing function of the quantity, while on the bid side, the average price is a decreasing function of the quantity. It occurs to me the graph is also (could be) a simple plot of any limit order book. I feel like we've surrounded this pretty good, thank you!
 
Top