FlorenceCC

Member
Hi

I have a couple of questions on the syllabus for chapter 7 as detailed below:

(1) when we talk about computing the test statistic for a single regression coefficient, we specify that it follows a student's t distribution with n-k-1 df (p43). Which we will compare against the corresponding critical t. Yet, when we talk about confidence interval, we mention for instance for instance that the critical value at 5% significance is 1.96, i.e. the z value. Wouldn't the appropriate critical value be the t at n-k-1 df? I believe that in application of the CLT, with a sufficiently large sample, it is ok to use a z value. My question would be more, within the context of the exam or a question, will it be made clear whether we should be "conservative" and find the critical t, or if the question expects us to use a z value?

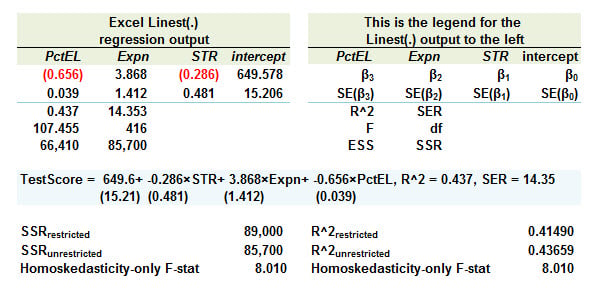
(2) On p46, the "overall" F statistic is explained as testing the joint hypothesis that all the slope coefficients are equal to 0. However I don't see a formula for it, which I found elsewhere as [(ESS/k)/(SSR/n-k-1)]. Is that a testable formula of the FRM?

Many thanks in advance for your feedback.

Florence
 

David Harper CFA FRM

David Harper CFA FRM
Subscriber
Hi @FlorenceCC
  1. Yes, you are exactly correct. And well-stated! This is true: "Wouldn't the appropriate critical value be the t at n-k-1 df?." To reduce the theory to bare bones: the OLS regression assumptions allow for us to assume the regression coefficients are normally distributed if we know the true (population's) variance of the error term in the regression. Analogous to how, when testing a sample mean, the normal is the correct distribution if we know the population's variance. But, realistically, in both cases we really don't know. So a realistic (aka, real-life) regression does not know the error term's "true" variance and, instead, is estimating it with the sample variance (i.e., the residual in the sample regression function is an estimator of the error in the population regression function). The consumes a degree of freedom and, strictly speaking, requires the student't s. Just like the test of the sample mean, realistically, requires the student's t. Further, you are absolutely correct that CLT is justifying the convergence toward normal as sample size increases (albeit in the regression, it is indirect). So, strictly speaking, the student's t is always correct. However, when the sample get large (by convention, n > 30) then the normal is a fine approximation of the student's t (notice that vice versa is not correct, subtle difference!). The exam shouldn't really alter your view, to my thinking. Much more likely is simply that an exam question, when taking a sample or regression, will tend to give an assumption of n > 30 (i.e., large sample) so that you can use safely the Z-values. (but the exam could possibly throw you a small sample expecting you to know that student's is correct, it's possible ...)
  2. But on the bottom of page 46, we do replicate S&W's formula for the F-statistic? especially as a function of R^2. And page 47 applies the formula in the example, to compute the F-stat of 8.01. The other formula you also retrieved is correct, too; actually, I am pretty sure my learning XLS at https://learn.bionicturtle.com/topic/learning-spreadsheet-stock-watson-chapter-4/ shows it calculated both ways, for the same result. Re: is it a testable formula? I hope not. We've tried over the years to push back on certain quantitative LOs and many of them have been softened to qualitative. The F-statistic LO previously included "define" or "calculate" in my recollection but notice the current LO: "Interpret the F-statistic." This is a strong indication that, appropriately, the formula itself will not be tested; rather, just may need to be interpreted. I hope that's helpful, thanks!
 

FlorenceCC

Member
Thank you very much @David Harper CFA FRM, very helpful as usual!

I think I get a little bit confused in my understanding of the F statistic that is replicated in the syllabus, i.e. F= [(SSR r - SSR unr/q) / SSR unr/(n - Kunr -1)].
I understood it as the homoskedastic-only Fstat to be used in case of a restrictions, to test the statistical significance on the regressors being restricted. But how do I use it if there are no restrictions, and i want to test the joint significance of all slope coefficients, aside from that formula above, which does not include the distinction between restricted and unrestricted?
I apologize I do not have access to the spreadsheets (probably a mistake!) so I can't "see" it on your real example.

Florence
 

David Harper CFA FRM

David Harper CFA FRM
Subscriber
Hi @FlorenceCC The F-statistic applies to the test of a joint hypothesis that several regression coefficients are equal to zero, according to the null. See our exhibit below, which replicates S&W's example. This is an regression with three independent variables such that TestScr = b0 + b1*PctEl + b2*Expn + b3*STR. The "overall regression" F-statistic is typically generated by the software; in my Excel below, =LINEST produces this overall regression F-stat = 107.455. But it can also be found with (ESS/df)/(RSS/df) = (66,410/3)/(87,500/416) = 107.455. It is potentially confusing because you might logically say that "this typical F-statistic is testing the joint null hypothesis that all three regressands are equal to zero, which is the special case of three restrictions," but S&W are calling this an unrestricted regression. That is, if we are restricting all of the coefficients (aka, imposing restrictions on all of the coefficients), it is the "unrestricted" regression! (which makes some sense actually)

Then, separately, in the exhibit below, there are homoskedastic-only F-stats = 8.010, calculated per F-stat as function of SSR (like your equation above) and R^2, restricted versus unrestricted. This is following S&W's example. These 8.01 are not a joint test of all three coefficients, but rather a joint test with only two (2) restrictions, q = 2: the joint null is that both STR and Expn are equal to zero. The F-stat of 8.01 uses as inputs either the unrestricted SSR (85,700) or unrestricted R^2 (0.437) which are produced by the overall regression. I hope that helps clarify!

0323-SW-fstat.jpg
 
Top