Learning objectives: Explain mean reversion and calculate a mean-reverting level. Define and describe the properties of autoregressive moving average (ARMA) processes. Describe the application of AR, MA, and ARMA processes.
Questions:
20.23.1. Below are plotted the autocorrelation function (ACF) and partial autocorrelation function (PACF) for a simulated time-series process. Please note that the horizontal dashed blue lines represent the 95.0% confidence interval.
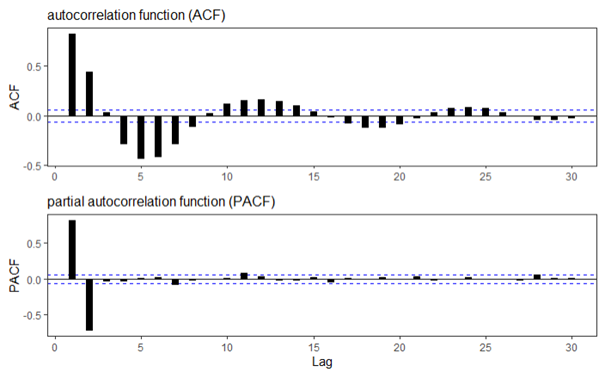
Which of the following time-series models is most likely described by these ACF and PACF plots?
a. MA(1) with an MA coefficient of -0.67
b. MA(2) with MA coefficients of -0.45 and +1.83
c. AR(1) with an AR coefficient of 0.25
d. AR(2) with AR coefficients of 1.4 and -0.7
20.23.2. Below are plotted the autocorrelation function (ACF) and partial autocorrelation function (PACF) for a simulated time-series process. Please note that the horizontal dashed blue lines represent the 95.0% confidence interval.
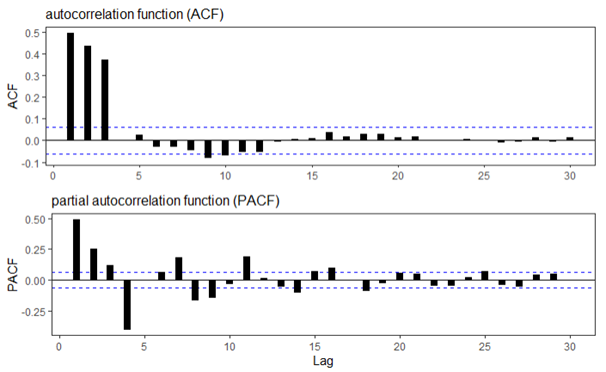
Which of the following time-series models is most likely described by these ACF and PACF plots?
a. MA(1) with a coefficient of 1.3
b. MA(3) with coefficients of 0.4, 0.6, and 0.8
c. AR(2) with coefficients of 1.5 and 0.8
d. AR(3) with coefficients of 0.3, -1.4 and 0.7
20.23.3. An ARMA(1,1) process evolves according to Y(t) = ẟ + ϕ*Y(t-1) + θ*ε(t-1) + ε(t). The plot below contains two 300-step ARMA(1,1) processes that differ only in their coefficients.
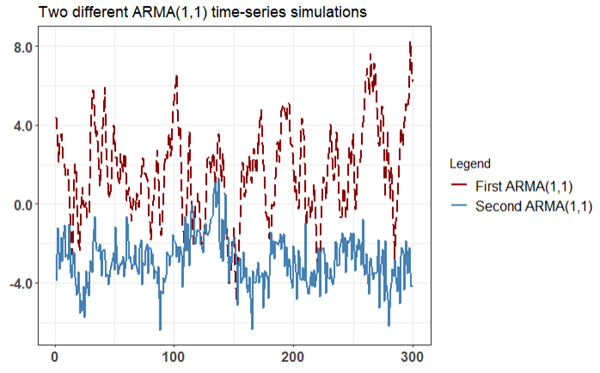
Which of the following statements is TRUE about the two ARMA(1,1) simulations above?
a. Both of the ARMA(1,1) processes are likely to exhibit slow decay in both the ACF and PACF
b. Both of the ARMA(1,1) processes are likely to cut off sharply at lag 1 in both the ACF and PACF
c. The first ARMA(1,1) process (i.e., plotted with a red dashed line) cannot be covariance-stationary
d. The unconditional mean of both ARMA(1,1) processes must be zero because all ARMA(1,1) have a long-run mean of zero
Answers here:
Questions:
20.23.1. Below are plotted the autocorrelation function (ACF) and partial autocorrelation function (PACF) for a simulated time-series process. Please note that the horizontal dashed blue lines represent the 95.0% confidence interval.
Which of the following time-series models is most likely described by these ACF and PACF plots?
a. MA(1) with an MA coefficient of -0.67
b. MA(2) with MA coefficients of -0.45 and +1.83
c. AR(1) with an AR coefficient of 0.25
d. AR(2) with AR coefficients of 1.4 and -0.7
20.23.2. Below are plotted the autocorrelation function (ACF) and partial autocorrelation function (PACF) for a simulated time-series process. Please note that the horizontal dashed blue lines represent the 95.0% confidence interval.
Which of the following time-series models is most likely described by these ACF and PACF plots?
a. MA(1) with a coefficient of 1.3
b. MA(3) with coefficients of 0.4, 0.6, and 0.8
c. AR(2) with coefficients of 1.5 and 0.8
d. AR(3) with coefficients of 0.3, -1.4 and 0.7
20.23.3. An ARMA(1,1) process evolves according to Y(t) = ẟ + ϕ*Y(t-1) + θ*ε(t-1) + ε(t). The plot below contains two 300-step ARMA(1,1) processes that differ only in their coefficients.
Which of the following statements is TRUE about the two ARMA(1,1) simulations above?
a. Both of the ARMA(1,1) processes are likely to exhibit slow decay in both the ACF and PACF
b. Both of the ARMA(1,1) processes are likely to cut off sharply at lag 1 in both the ACF and PACF
c. The first ARMA(1,1) process (i.e., plotted with a red dashed line) cannot be covariance-stationary
d. The unconditional mean of both ARMA(1,1) processes must be zero because all ARMA(1,1) have a long-run mean of zero
Answers here:
Last edited by a moderator: