Errors Found in Study Materials P2.T5. Market Risk (OLD thread)

Status
Not open for further replies.

Naveen Kanth

New Member
Hi in R38 P2 T5 , Reading material , page 38 in spearman's Rank correlation , example has been taken from GARP reading, it would be better if table 8.1 (In GARP reading it is completely given ) and then next step of order the return set pairs is shown . ( ranked return of X).
 

David Harper CFA FRM

David Harper CFA FRM
Subscriber
Hi in R38 P2 T5 , Reading material , page 38 in spearman's Rank correlation , example has been taken from GARP reading, it would be better if table 8.1 (In GARP reading it is completely given ) and then next step of order the return set pairs is shown . ( ranked return of X).
Thank you @Naveen Kanth but I don't quite understand. @Nicole Seaman when you get a chance, can you seek clarification on this feedback item? Thanks!
 

RushilChulani

New Member
AIM: Describe the peaks-over-threshold (POT) approach.
Compute VaR and expected shortfall using the POT approach, given various parameter values.


Questions:

87.1 If X is a random i.i.d loss with distribution function F(x), and (u) is a threshold value of X, what function defines the peaks-over-threshold (POT) approach?
a. F(x) = P{ X <= x | X > u}
b. F(x) = P{ X <= x | X = u}
c. F(x) = P{ X - u <= x | X > u}
d. F(x) = P{ X - u <= x | X = u}

87.2 Assume the following GP parameters under POT approach to extreme values: scale (beta) = 0.9, shape/tail index (xi) = 0.15, threshold (u) = 4.0%, and the percentage of observations above the threshold (Nu/n) = 10.0%. What are, respectively, the 99.5% and 99.9% value at risk (VaR)? (note: variation on Dowd's Example 7.5)
a. 3.95% (99.5%) and 5.24% (99.9%)
b. 4.15% and 6.24%
c. 7.40% and 9.97%
d. 9.03% and 11.31%

87.3 Using the same assumptions and same POT approach (generalized Pareto distribution), what are, respectively, the 99.5% and 99.9% expected shortfall (ES)?
a. 7.40% (99.5%) and 9.97% (99.9%)
b. 9.06% and 12.08%
c. 10.22% and 14.65%
d. 12.62% and 16.68%

Answers:

87.1 C. F(x) = P{ X - u <= x | X > u}
Conditional on X exceeding the threshold (X>u), what is the probability that the loss in excess of the threshold (X-u) is less than or equal to x (i.e., CDF).
… note that F(x) is the parent distribution.

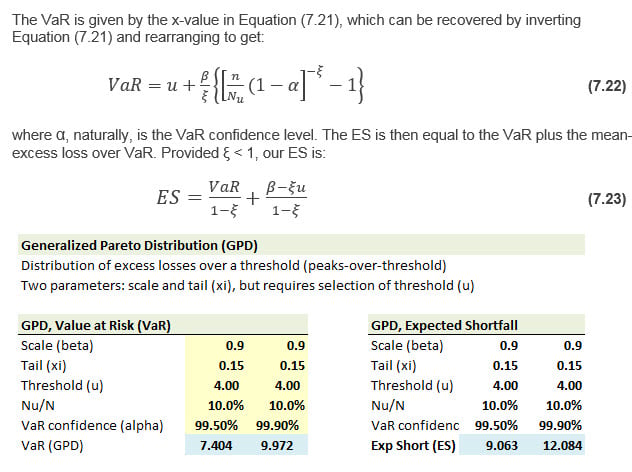
87.2 C. (7.404 @ 99.5% and 9.972 @ 99.9%)
See spreadsheet

87.3 B. (9.06 @ 99.5% and 12.08 @ 99.9%)
See spreadsheet

t5-87-evt-pot.jpg
@David Harper CFA FRM @Nicole Seaman I had a confusion with the study notes associated with this question. I believe equation 7.18 on page 5 of the associated Study notes is wrong. It misses the condition that "X - u <= x". Please correct me if I am wrong. Thank you!
 

David Harper CFA FRM

David Harper CFA FRM
Subscriber
Hi @RushilChulani Yes, you are correct (cc @Nicole Seaman) , there is a typo. Apologies. Thank you. On page 5 on the study note, it currently reads "Fu(x) = Pr{X - µ ≤ | X > µ } ... " which omits the x, as it should read ""Fu(x) = Pr{X - µ ≤ x | X > µ } ... ". We will fix this. Thank you!
 
Hi @David Harper CFA FRM ,

I might have discovered a typo in Tuckman chapter 8, study notes p. 42.

  • Current calculation approach of one-year forward discount facor at node 1,1: 50%*[(1/1.1840) + (1/1.1040)]/1.10 = 0.766371
  • How it should be at node 1,1: 50%*[(1/1.1840) + (1/1.1040)]/1.142 = 0.766371

  • Current calculation approach of one-year forward discount facor at node 1,0: 50%*[(1/1.1040) + (1/1.0240)]/1.10 = 0.886233
  • How it should be at node 1,0: 50%*[(1/1.1040) + (1/1.0240)]/1.062 = 0.886233
Can you backcheck and confirm?

Thanks and best,
 

David Harper CFA FRM

David Harper CFA FRM
Subscriber
Hi @aangermeyer Yes, you are absolutely correct. Thank you for identifying these typos (cc @Nicole Seaman ). The solutions of 0.766371 and 0.886233 do reflect the denominators /1.142 and /1.062 but the text is incorrect. Really appreciate your attention to detail here. Thank you!
 

evelyn.peng

Active Member
Hi,
I tried to search the forum to see if this was previously discussed but couldn't find anything specific. Apologies if this is already discussed.
The learning spreadsheet for Dowd Ch3 and Ch4 does not seem to contain any of the examples used in the Study Notes/Learning Video. For instance, page 17 of the Study Note references return data for Apple, Applied Materials and HP Inc. for 21 days. I'm trying to follow the bootstrap method by replicating David's steps but I cannot find where this data is stored in the learning spreadsheet.
Thanks,
Evelyn


1562784371385.png
 

David Harper CFA FRM

David Harper CFA FRM
Subscriber
Hi @evelyn.peng That's a good point, that XLS apparently has not been updated to match the Study Notes. I've tasked myself to do that, but I can't do it immediately. I will do it ASAP and notify you here after I have updated the XLS. Thanks,

(in the meantime for Evelyn: working XLS to go here: tbd)
 

Detective

Active Member
Minor points:

R39-P2-T5-Tuckman
(1) p.39

Missing expectation sign in Jensen Inequality:
1569678866099.png

E(1+r) = E(1) + E(r) = 1 + E(r)

In version of Tuckman's book I have it is stated correctly on bottom of page 232 (equation 8.6).

(2) p.54, addition error:

1569697068172.png
 
Last edited by a moderator:

tom87

Member
Hello,

It seems to me there is a typo in Tuckman R39-P2-T5-Tuckman (p29). I haven't seen it reported anywhere else so I will post it here:

1573221866009.png

The denominator should be 3,613.25.
 
Last edited:
Hi David & Nicole,

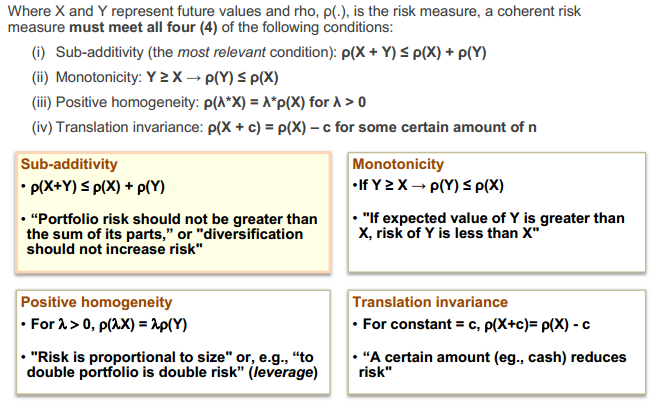
I noticed that in "Estimating Market Risk Measures" on page 14, the equations for sub-additivity and monotonicity are interchanged, i.e., the sub-additivity equation is mentioned against monotonicity and the monotonicity equation is mentioned against sub-additivity.
 

megan.holt

New Member
Were the study guides for the following removed? They seemed to be present when I copied the P2.T5 planner earlier in the fall to track my studying but I'm not able to see them available for download anymore.
  • Dowd, Chapters 3 & 4
  • Meissner, Chapters 1, 2, 3 & 4
  • Tuckman, Chapters 6, 7, 8, 9 & 10
  • Dowd, Chapter 7 (from Operational Risk topic)
 

txiong

New Member
Hi David (@David Harper CFA FRM )

It seems like the section regarding the effectiveness of the Vasicek model is missing from the Tuckman Chapter 9 study note. I was wondering if this is intentional?
1582399968041.png

Thank you
 

evelyn.peng

Active Member
Hi David (@David Harper CFA FRM )

It seems like the section regarding the effectiveness of the Vasicek model is missing from the Tuckman Chapter 9 study note. I was wondering if this is intentional?
View attachment 2580

Thank you
Hi, I captured the following notes from the original text for the LO of "Describe the Effectiveness of the Vasicek Model"; hope this helps you too:

Mean Reversion:
- captures several economically intuitive term structure behaviour:
1) risk neutral --> drift k (theta - r) dt combines interest rate expectations and a risk premium
2) market prices do not depend on how the risk neutral drift is divided between interest rate expectations and risk premium

Volatility & Convexity:
- mean reversion lowers longer term rate volatility and impact of convexity on these rates
- violates independence (i.i.d.) --> square root rule (SRR) overstate the volatility
therefore, downward sloping volatility term structure

Cheers,
Evelyn
 

frenchmarmot

Member
Subscriber
Hi,
@David Harper CFA FRM I have spotted two definitions of a coherent risk measure that seem not to be aligned, according to my research at leadt. Would be happy to have your thoughts on that.
On page 6 of P2.T5 in study notes "Messages from the Academic Literature on Risk Measurement for the Trading Book", I noticed that the equation for monotonicity and transition seem in contradiction with that from previous chapter (Dowd).

Monotonicity : R(L1) < R(L2) if L1 < L2
=> To be in-line with definition from first chapter (Dowd), shouldn't it be R(L1) >= R(L2) if L1 =< L2 ?

Transition : R(L + a) < R(L) - a
=> Not sure how this is similar to R(L + a) = R(L) - a ?

Greg
 
Last edited:
Status
Not open for further replies.
Top